
Having a real estate website is one thing, but knowing how well it does and where it could be optimized is something else.
If you don’t know how your website is doing, you will fly blind. You will also miss many opportunities to improve its lead generation capacity.
And that’s what we want from a real estate website.
Therefore, using some way of analyzing website data is essential.
This is where one powerful and free tool comes in quite handy, which is Google Analytics.
And in this article, I will discuss how you can use Google Analytics for real estate.
I will show you three benefits of using it, how to set it up, and how to use it strategically.
What is Google Analytics?
Google Analytics was developed initially by a company named Urchin Software Corp., acquired by Google in 2005.
This is the same year it launched the analytics platform under Google’s brand.
As the name already reveals, Google Analytics is a web analytics service that can track and report website traffic.
Since 2019, this platform has been the most often used analytics platform on the web. It also allows us to analyze data from Android and iOS apps.
What can you track with it? Among many other things, you can track the following:
- Website activity
- Session durations
- Pages per sessions
- Bounce rates
- Landing page quality
- Conversions, such as sales, viewing a specific page, sales, lead generation, and downloads
- Poorly performing pages by using funnel visualization, how long visitors stayed, and where they came from
Since 2011, you can also gain insights about live visitors.
If you want to track several websites at once, you can do so with up to 100 site profiles per website you can create as a user.
However, some limits exist. You shouldn’t have traffic of more than 5 million page views per month.
Three Benefits of Using Google Analytics for Real Estate
From the above information, you might already guess some of the benefits of using Google Analytics for Real Estate.
1) Find Out How Visitors Find Your Real Estate Website
Google Analytics allows you to find out from which web source and geographical region visitors come to your site.
Knowing the geographical regions of your visitors can inspire you for particular marketing campaigns and goals in the respective areas.
Additionally, it helps you determine if there is growth potential in specific areas.
You can also find other website traffic sources, such as visitors from specific organic search results, paid marketing campaigns, or direct visitors.
The latter is usually a hint of a certain degree of brand awareness.
This data can be overlayed with geographic data.
So you can determine how long a visitor from a Google Ad campaign stayed on a particular page and if he took some action (e.g., filling out a form).
This can be compared with other geographic regions, and you can find out if you should start to focus your campaigns on some geographic areas and exclude others.
As you can see, the combination of possibilities is almost endless, and many benefits from one category overlap with others.
This leads me to the next benefit.
2) Performance Tracking of Your Real Estate Pages
Suppose you don’t know how your different pages, such as blog articles, landing pages, single property listing pages, or sales pages, are doing. In that case, you are flying blindly and won’t know what you need to optimize.
So with Google Analytics, you can check how much traffic certain pages receive, how long visitors stay on them, how well certain pages perform on social media, and if they lead to conversions.
The duration of a session is an important hint because the longer visitors stay on a certain page, the more likely it is that you somehow cater to their needs.
And the more you can fulfill some sort of need, the higher the chances that a particular visitor may convert into a lead.
3) Conversion Performance Tracking
One of the most important benefits of using Google Analytics is finding out how well certain website pages perform in conversions.
This benefit could be a subsection of the “Performance of Your Pages.” Still, due to its importance, it earns an extra section.
One of the main goals, if not the main goal of a real estate website, is to convert visitors into real estate leads (lead generation).
It’s nice to know where the traffic is coming from and how different popular pages are, but who cares if they don’t convert some visitors into leads?
So with Google Analytics, you can discover what areas and pages of your website generate the most leads and which don’t.
This is done through conversion events.
You can track if a visitor filled out a contact form, opted into your mailing list, or clicked a social sharing button.
Suppose you could sell properties like small eCommerce items on a website. In that case, you could also track the direct sales of different website pages.
How to Setup Google Analytics
After you know more about the three benefits of using Google Analytics in Real Estate, you may want to install it and set it up with your website.
If you have it already set up, you can ignore this section.
There are five steps to set up Google Analytics, which I will discuss below.
Step 1 – Google Tag Manager
The Google Tag Manager is a free tag management system. It can gather data on your website and send it to other platforms, such as Google Analytics and Facebook Analytics.
By the way, tags are snippets of code or tracking pixels similar to cookies.
Suppose you want to easily update and add new tags to your Google Analytics. In that case, it is not necessary to manually create new code on the backend, which can save a lot of time.
For example, if you have a lead magnet, such as a PDF buyer‘s guide for real estate.
If you want to track how many people clicked on this downloadable PDF, you can add a new tag to your Tag Manager so that it can be tracked.
Without it, you would have to manually update all the download links to the PDF.
If you don’t have an account yet, you will need to create a new one by using the Google Tag Manager Dashboard.
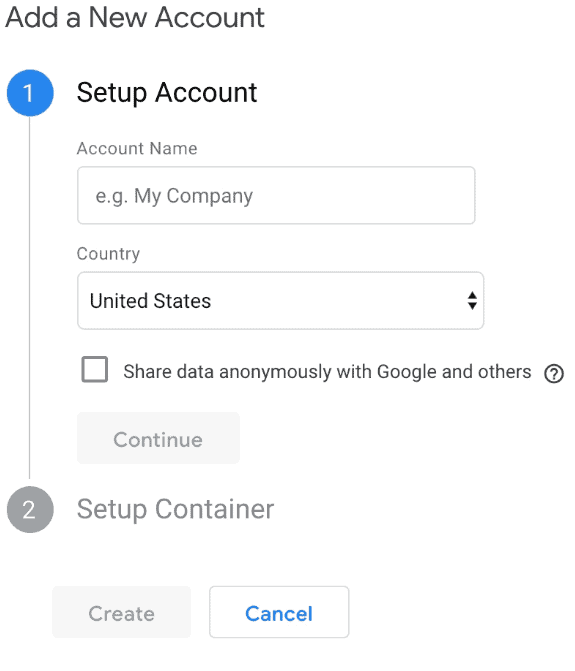
Now, you enter an account name and then click continue. Next is setting up a list where your website’s macros, tags, and rules are stored.
In Google Tag Manager’s terms, this is called a “container.”
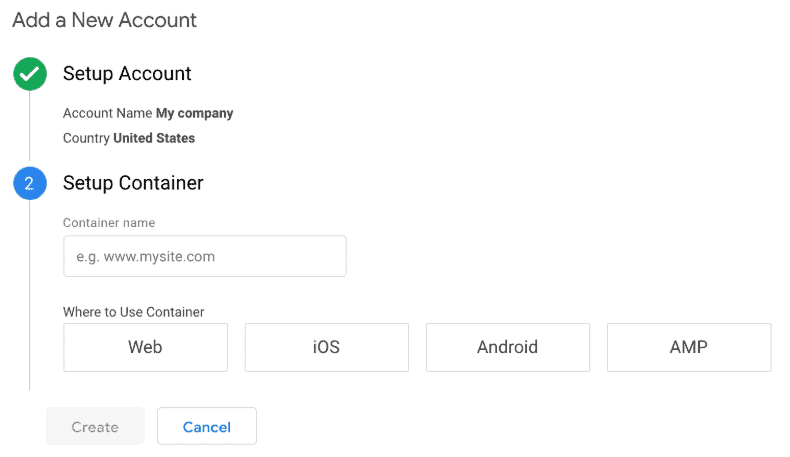
To avoid confusion, give the “container” a descriptive name and select the type of content it will be connected with, such as Android, web, iOS, Android, or AMP.
In the case of a real estate website, this will generally be“web.” Now you click “create.”
After that, you must review and agree to the Terms of Service.
Next, you will receive the installation code snippet of the newly created container.
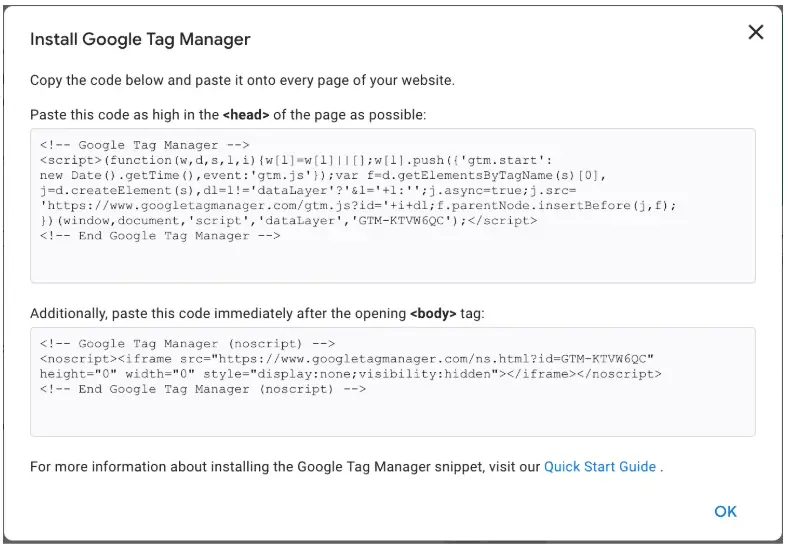
If you don’t know any coding, you might be intimidated by what you see next because it will be a piece of code that you need to paste into the backend of your website.
This will have to be added to every page of your website.
This first one should be put in the header, and the second one after the opening of the body.
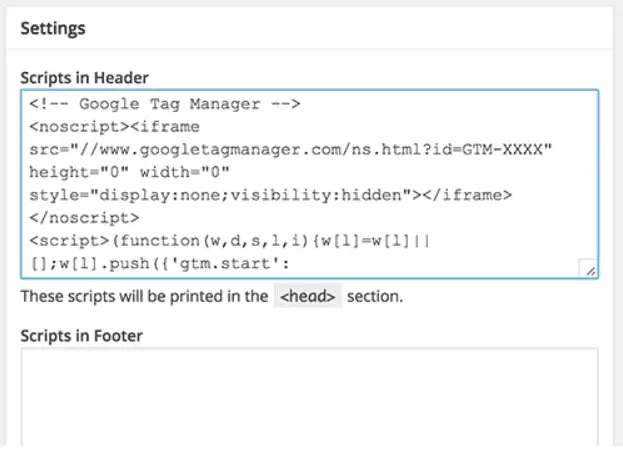
This will be easier if your website is based on WordPress because it can be added to your WordPress theme.
But there are also some plugins out there that can make this even easier.
Here are some Google Tag Manager Plugins for WordPress:
- Google Tag Manager for WordPress
- Metronet Tag Manager
- Meta Tag Manager
- Image Tag Manager
- Tag Manager – Header, Body, and Footer
Step 2 – Finally, the Google Analytics Account
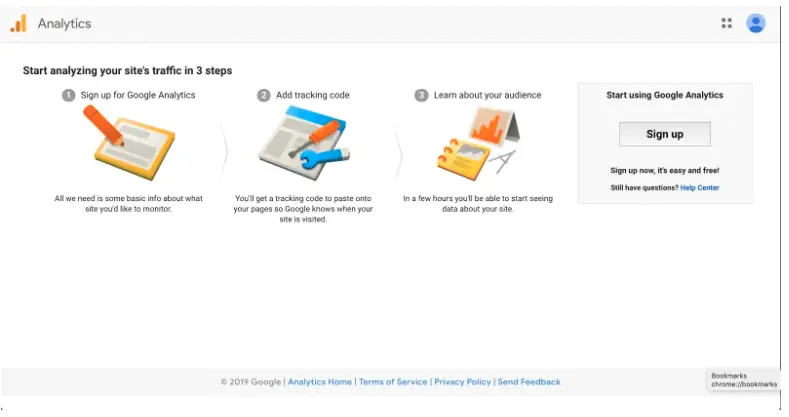
Now, you can sign up on the Google Analytics page to create a new account.
Here, you enter the new name of your account and the name of your website, including your website’s URL.
Don’t forget to also select your industry category and the time zone on which the reports will be based.
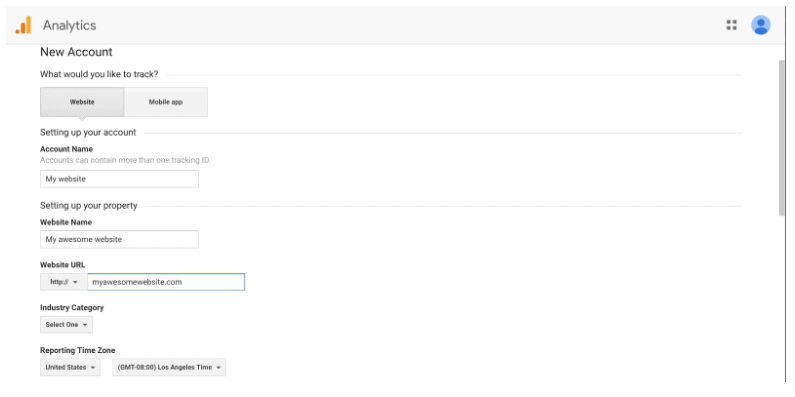
After that, you will need to accept the Terms again to receive your tracking ID.
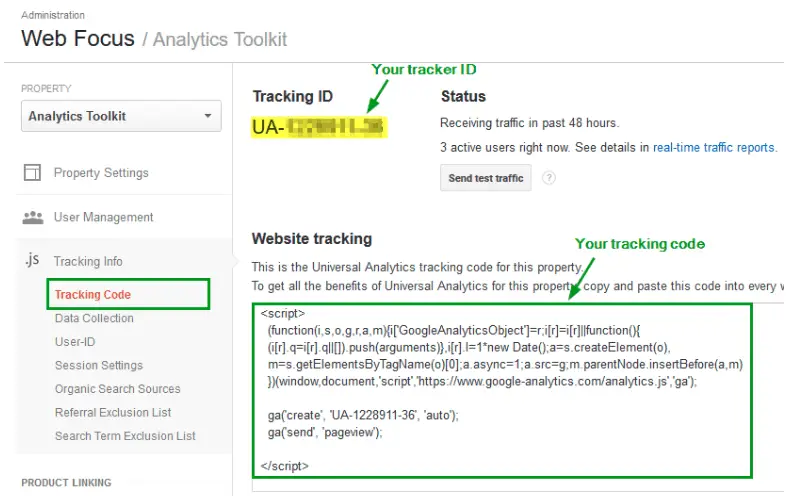
The tracking ID will look something like this UA-00000-1.
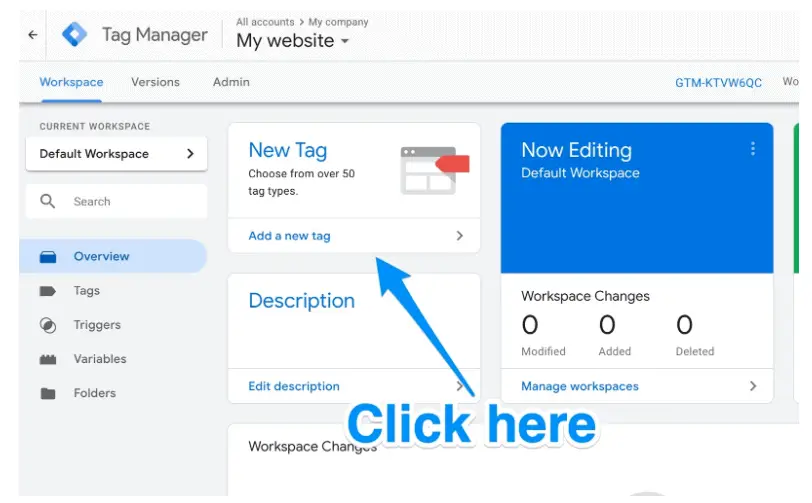
Step 3 – Now You Can Set Up the Analytics Tag With the Google Tag Manager
Now, go to your Google Tag Manager dashboard and click on the “Add a new tag button.”
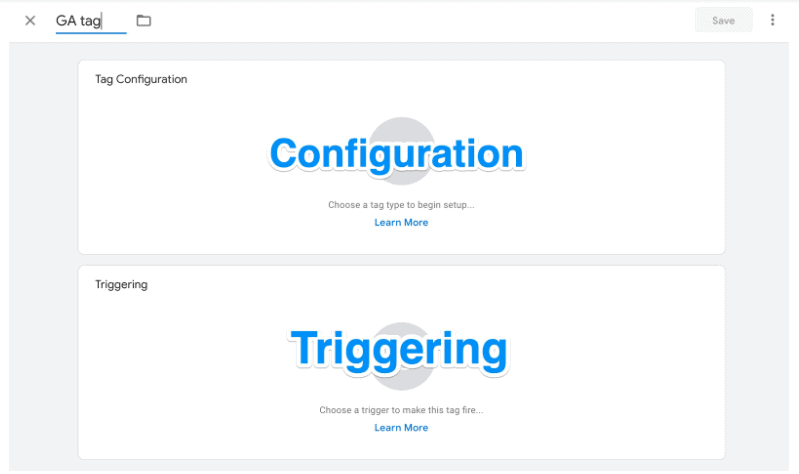
On a new page, create your new website tag, where you can customize two areas of the tag:
- Configuration
- Triggering
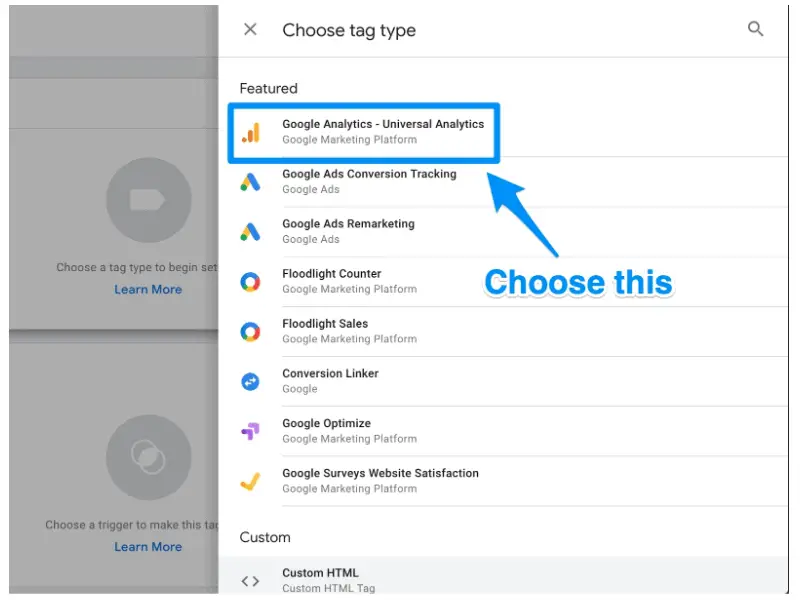
Now you select the type of tag you want to create and select the “Universal Analytics” option.
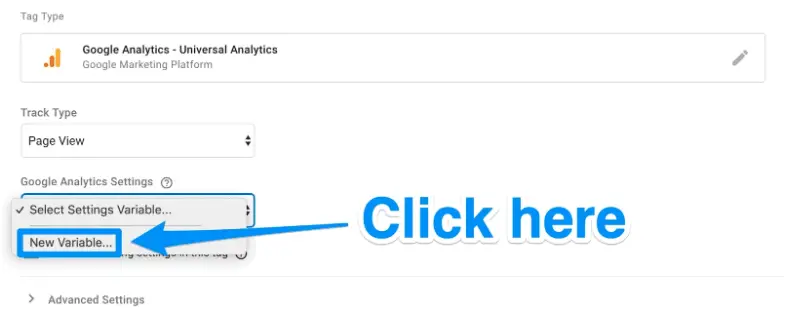
Next, select the type of data you want to track. Then, go to your Google Analytics Settings and select “New Variable” from the dropdown menu.
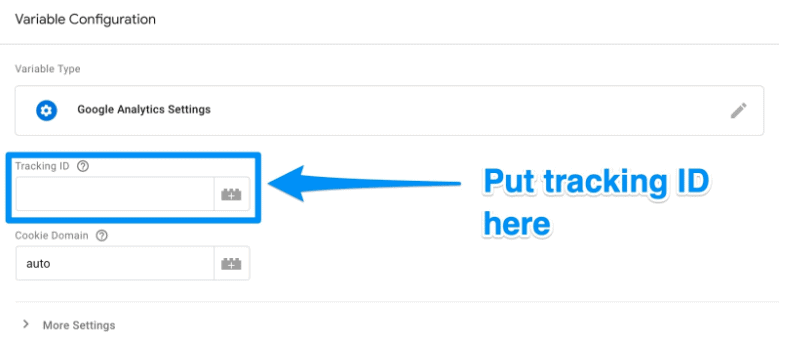
On a new window, you can enter your Google Analytics tracking ID, which then sends your website’s data directly to Google Analytics.
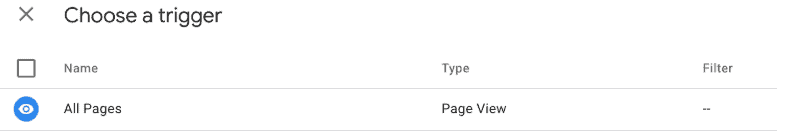
Now you go to the “Triggering” section, so you can select the data you want to send to Google Analytics.
Click on the button “Triggering,” and you will arrive on the “Choose a trigger” page, then click on “All pages.” This will send data from all your pages.
Once done, the set up should look like this:
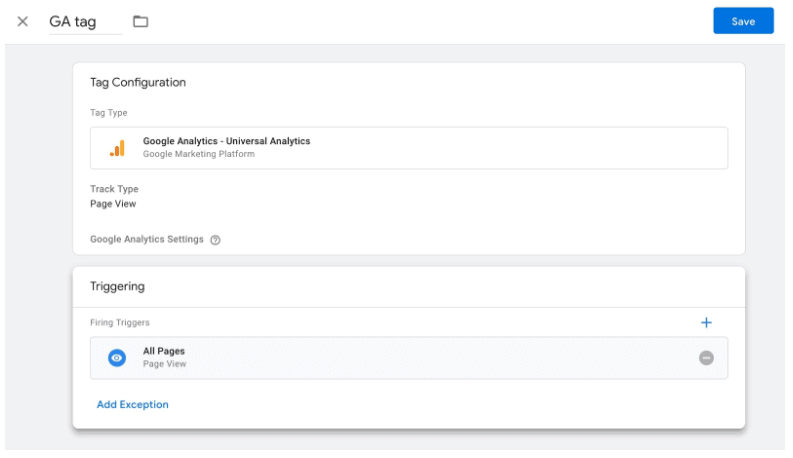
Finally, you need to click on “Save,” and you will have a new Google Tag to send data to your Google Analytics account.
Don’t Like the Google Tag Manager but Have a WordPress-Powered Real Estate Website?
I don’t like Google Tag Manager too much. Why is that?
I like the wide range of functionality, but I don’t like its usability, which can sometimes be confusing.
There is an even more straightforward way to add Google Analytics tracking on your website without using Google Tag Manager, provided it is based on WordPress.
You can take a shortcut using a simple plugin. You just need to enter your Google Analytics Tracking ID number.
Here is a selection of WordPress Plugins for Google Analytics tracking that you might want to consider:
- MonsterInsights
- exactmetrics
- Analytify
- Google Analytics by 10Web
- GA Google Analytics
- WP Google Analytics Events
- Site Kit
- 10Web
Step 4 – If You Already Know Your Google Analytics Goals – Goals Setup
With Step 3, you are basically done, but should you already know which goals you want to track in Google Analytics, you can use Step 4 to set your goals at once.
Later in this article, I will also provide you with worthwhile tracking goals for your real estate website.
But should you already know your KPIs (key performance indicators), you want to let Google know what you are looking to track.
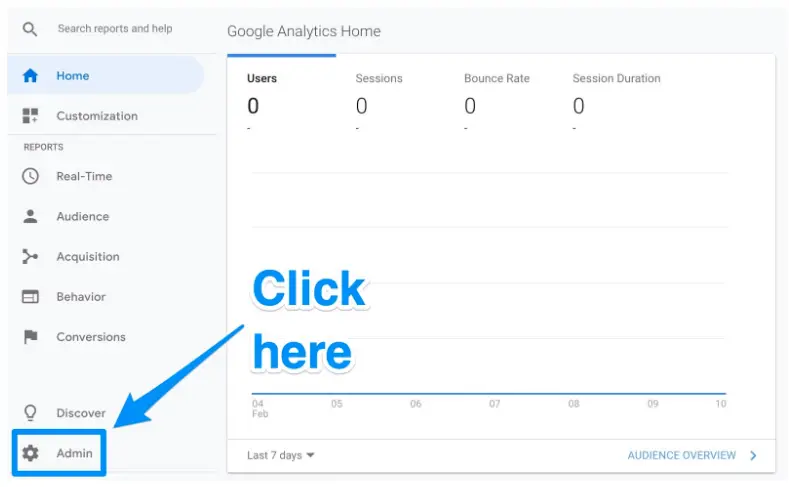
This is done by defining the goals in your Google Analytics Dashboard.
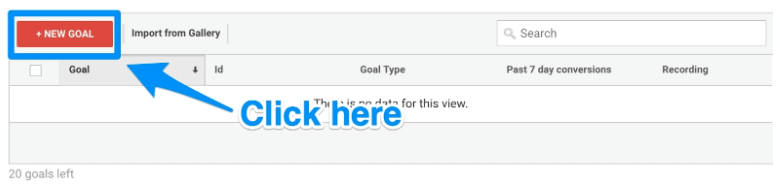
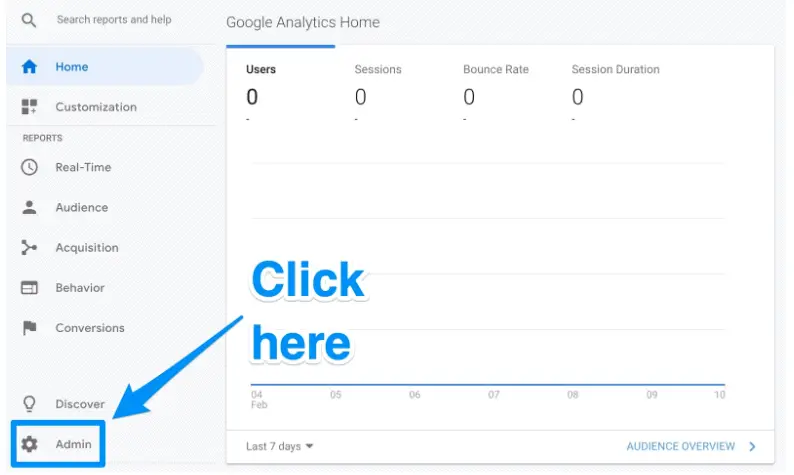
Just click on the Admin icon in the bottom left corner.
Now you will arrive at another window with the “Goals” button.
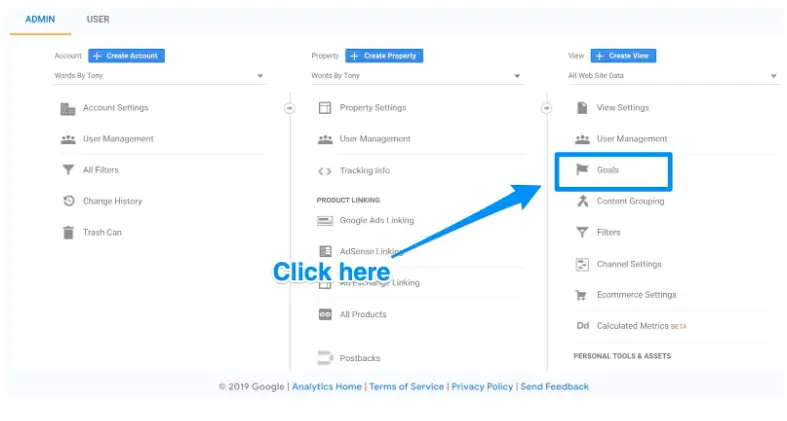
Click on the “Goals” button, so you can create a new goal.
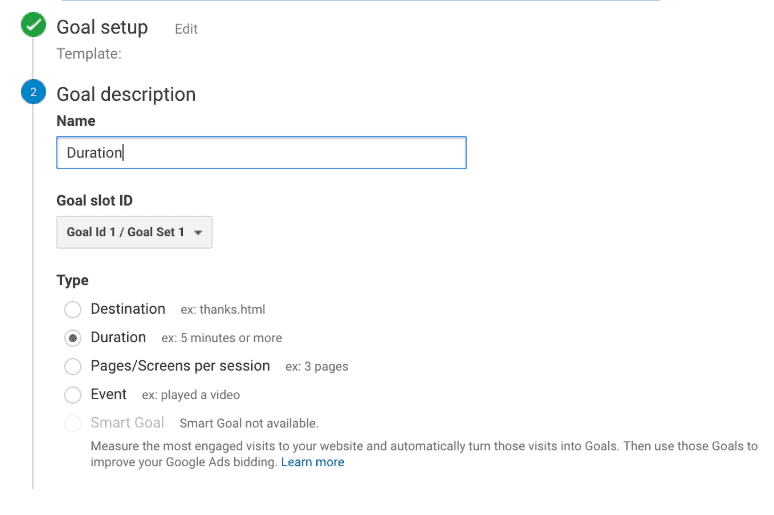
Here, you will find different goal templates displayed, from which you can select the ones that might match yours.
Select the type of goal you need, such as:
- Destination: a particular web page you want your user to visit
- Duration: a specific time on your website
- Pages/Screens per session: a specific amount of pages
- Event: among others, a click on a link
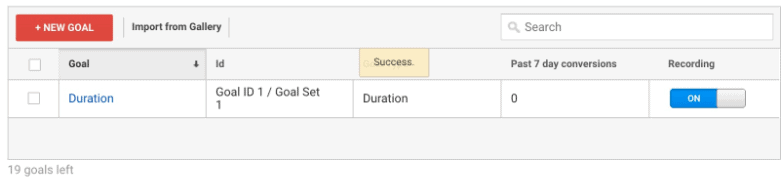
When you are ready, you can save the new goal, and Google Analytics will start to track the respective goals.
Don‘t get overwhelmed with all the goals you can track. Later in my article, I’ll provide some metrics you can focus on for your real estate business.
Optional Step 5 – Linking Google Analytics With the Google Search Console
You can and probably should link your Google Analytics account with the Google Search Console.
I know you might have had enough of linking different, more or less user-friendly accounts with each other but bear with me. It can be worthwhile to also take this optional step.
If you don’t have a Google Search Console account yet, getting one might be worthwhile even if you don’t plan to link it with Google Analytics.
Why?
It’s a great tool for content marketing and search engine optimization efforts to gain valuable search metrics and data.
What can you do with it?
-
- You can find out your site’s search crawl rate and what internal and external pages link to your website.
- You can check when Google analyzes your website and the keywords you rank for in the search engine results.
- Should you need to change your domain name for different reasons (sometimes for potential branding issues), you can manage better domain redirects with Google’s Search Console.
Suppose you already have an email address with Google. In that case, you can automatically access your Google Search Console account with your account credentials.
To use it, you just need to confirm that you are the owner of the respective website.
I won’t go too much into how to set everything up in the Google Search Console, but you can find a good guide on this website.
A bit further below, within the following steps, you will need to add a new website to the Search Console and learn this anyway.
So, let’s get back to the linking steps.
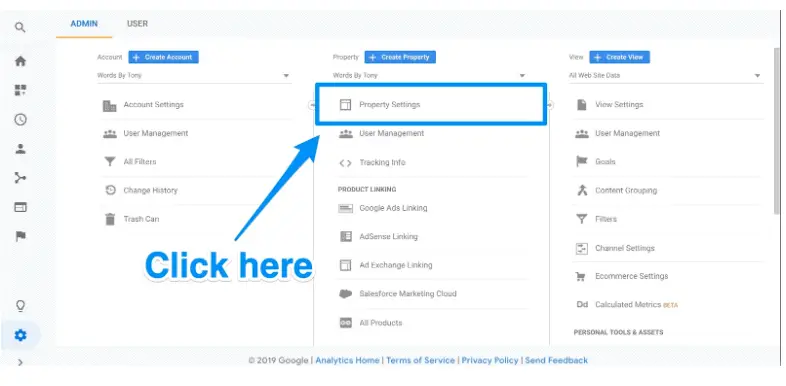
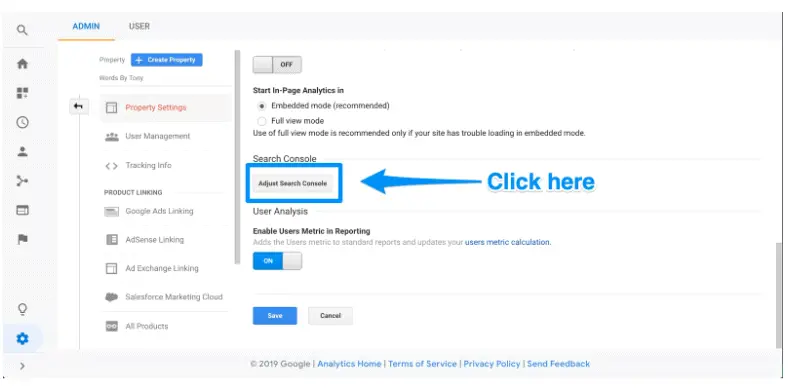
After that, click on “Property Settings,” which you can find in the middle column, and then scroll down and click on “Adjust search console.”
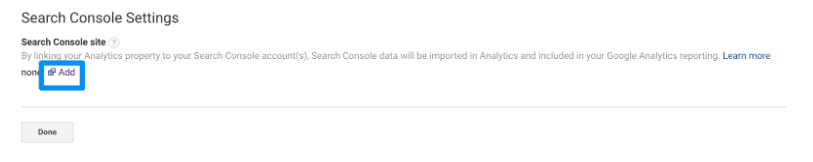
This is the place where you can now add your website to Google Search Console.
You’ll be led to this when you click the “Add” button (below).
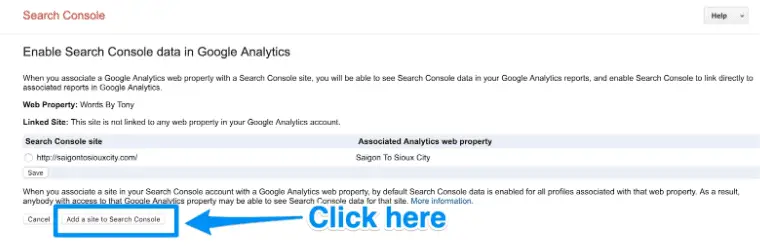
Click on “Add a site to Search Console.”
Next, you can add a new website to Google’s Search Console. Here you just enter your website’s name and click “Add.”
Now, follow the directions to add the HTML code to your website, and click on Save. This will take you back to Google Analytics.
Give it some time until you can see your data.
How to Use Google Analytics Strategically for Real Estate
When it comes to using Google Analytics, go about it strategically. Why?
If you try to track everything without any goal or focus, you will get overwhelmed with data quickly.
You won’t get the benefits of gathering data from your website traffic.
So, here are some questions you might want to ask yourself to get more strategic:
- What metrics do I want to track, and why?
- Which key metrics can I identify?
- What are the big things I can start with?
- What page on my website gets a lot of traffic, and why is it intriguing (made them click, interact, spend time there, etc.)?
- From which traffic sources does the traffic to the best-performing content come?
- On which type of content do visitors spend most of their time?
- What page has the highest conversion rates (e.g., email opt-ins, contact forms sent, call schedule form sent, etc.) and why?
- What audience profile could I build with the data I aim to track?
- What is the lowest-performing page, and why?
The three 80/20 questions, or rather 90/10 questions that basically summarize all of the above ones are the following:
- Which 10% of my pages lead to 90% of my conversions, and why?
- Which 10% of my traffic sources lead to 90% of my overall website traffic?
- What 10% of all my different audience profile types make up 90% of my leads?
Important Analytics Reports to Look At
To get some inspiration for the questions above, here are 13 analytics reports you may want to look at regularly.
1) Source/Medium – What Channels Brought Traffic to Your Website
You can find this report by clicking “All Traffic” and “Source/Medium.”
This report will help you segment where your website visitors come from and which sources bring in the most traffic.
2) New vs. Returning Visitors
You can find this report by clicking on “Audience,” then “Behavior,” and then “New vs. Returning.”
If you have a real estate website, you want new visitors and visitors that come back to it.
For instance, a revealing scenario could be that you find out about a high bounce rate related to returning visitors.
This would indicate that there is something that turns returning visitors off.
3) The Common Paths Visitors Take (Users Flow)
You can find this report by clicking “Audiences” then “Users Flow.”
This report will reveal how users navigate your real estate website and the most common sequences they take from page to page.
What’s a hint that users may be serious about doing business with you?
After visiting your property listing pages, they visit your contact page or a page where you have a contact form available.
This can all be found in this type of report.
4) On Which Page Visitors Entered Your Website (Landing Pages)
You can easily find it by clicking on “Behavior,” “Site Content,” and then on “Landing Pages.”
This report is quite straightforward. It shows you on which page visitors entered your website and which generates traction.
5) Channels
You can generate this report by clicking on “Audience,” “All Traffic,” and then on “Channels. “
It will help you determine how much traffic comes from social, direct, referral, email, and organic searches.
This will also reveal which traffic channels might be weak and could still be improved.
6) Which Google Terms Generate Traffic to Your Website (Search Queries)
To generate this report, just click on “Acquisition,” “Search Engine Optimization,” and then on “Queries.”
This report can help you immensely with your keyword strategy and content marketing efforts.
You can find new terms and phrases you didn’t think of in your keyword strategy.
You could start using these new keywords on your real estate website to dominate more of these keywords and phrases, and that’s just one use case.
7) Specific Interactions Users Have on Different Pages (Top Events)
You can generate this report by selecting “Behavior,” “Events,” and then “Top Events.”
This report is especially interesting when you want to learn about your real estate website conversions.
So, generally speaking, it helps you track particular actions your visitors take on your real estate website.
This can also help you improve the click-through and conversion rates of important pages, such as pages with contact forms and other pages where you expect some sort of user interaction or behavior.
For example, you could set up an event to find out if people click on a chatbot you have implemented on your site.
8) Exit Pages
You can generate this report by clicking on “Behavior,” “Site Content,” and then on “Exit Pages.”
It will help you determine the last pages visited during a web session. This will give you hints about which pages visitors leave most often.
You can then look at these pages and see what could be improved.
9) Content Drilldown
You can find this report by clicking on “Behavior,” “Site Content,” and then on “Content Drilldown.”
Suppose your real estate website is well-organized in subfolders.
In that case, this report can be helpful to check which pages and content produce a good amount of traffic and sessions and which don’t.
10) Devices
You can generate this report by clicking on “Audience,” “Mobile,” and “Devices.”
This one is also pretty straightforward and will show you how your traffic from different devices is doing.
It can also indicate if your real estate website provides a good user experience for mobile users.
11) Location
Generate this report by clicking on “Audience,” “Geo,” and then on “Location.”
By generating this report, you will discover where your traffic is coming from geographically.
This can give you a lot of additional information about your target audience.
You’ll see which countries visitors come from and drill down to the region and towns.
So by having this information, you could adapt your content and copy accordingly and may increase your conversion rates.
12) Age/Gender
You can find this one by clicking on “Audience,” “Demographic,” “Age,” and “Gender.”
It is another helpful report for getting to know your audience.
You can see which demographic group visits your real estate website most.
So, for example, you could determine whether you attract more millennials or baby boomers.
13) Frequency and Recency
You can generate this report by clicking on “Audience,” “Behavior,” and “Frequency & Recency.”
This report counts the number of days since the last website session.
This helps you determine which traffic percentage hasn’t recently been to your real estate website.
Concluding this article, I will give you a nice table overview of the different Google Analytics report types categorized in the three 90/10 questions I gave you above.
So you know which central question you are answering with which report.
| Which 10% of my pages lead to 90% of my conversions? | Which 10% of my traffic sources lead to 90% of my overall website traffic? | What 10% of all my different audience profile types make 90% of my leads? |
|---|---|---|
| New vs. Returning Visitors | Source/Medium | Landing Pages |
| Users Flow | Channels | Content Drilldown |
| Top Events | Search Queries | Devices |
| Exit Pages | Location | |
| Frequency and Recency | Age/Gender |
This article has been reviewed by our editorial team. It has been approved for publication in accordance with our editorial policy.
- Why Real Estate Conversion Rates Are 6-Times Below Average - March 21, 2024
- How to Manage Your Apartment Advertising Campaign - February 23, 2024
- Finding Marketing Channels for Apartment Advertising - February 12, 2024